Ahead of entertainment’s most exclusive and glamorous night of the year, a new study demonstrates just how exclusive film and television can be when it comes to women, people of color and the LGBT community. The results reveal that the prequel to #OscarsSoWhite is #HollywoodSoWhite.
The Comprehensive Annenberg Report on Diversity (CARD) is the first of its kind — an exhaustive analysis and ranking of film, television and digital streaming services that catalogues speaking characters, people behind the camera, CEOs and executives.
Authored by professor Stacy L. Smith and released by the Media, Diversity & Social Change (MDSC) Initiative at USC’s Annenberg School for Communication and Journalism, the analysis found that only 28.3% of all speaking characters across 414 films, television and digital episodes in 2014-15 were from underrepresented racial/ethnic groups. This is 9.6% below the U.S. population norm of 37.9%. One-third (33.5%) of speaking characters were female. Behind the camera, a mere 15.2% of all directors and 28.9% of writers across film and every episode of television and digital series were female. Less than one-quarter (22.6%) of series creators were women across broadcast, cable and streaming content.
“This is no mere diversity problem. This is an inclusion crisis,” said Smith, Founding Director of the MDSC Initiative. “Over half of the content we examined features no Asian or Asian-American characters, and over 20% featured no African-American characters. It is clear that the ecosystem of entertainment is exclusionary.”
The report examined 109 films released by major studios and their art-house divisions in 2014. Additionally, 305 television and digital series across 31 networks and streaming services were analyzed. Smith and her team evaluated over 11,000 speaking characters for gender, racial and ethnic representation, and LGBT status. Additionally, in excess of 10,000 directors, writers, and show creators, along with more than 1,500 executives at the different media companies studied were evaluated based on gender.
“This is a landmark study,” Smith said. “No one has looked from CEO to every speaking character across film, television, and digital content. The results speak to the landscape of media and the erasure of different groups on screen and behind the camera.”
Ten companies responsible for media content were graded based on their on screen and behind the camera representation of women and people of color.
None of the six film distributors examined received a passing grade on the Inclusion Index. Of the 30 tests conducted, 24 or 80% yielded a Not Inclusive ranking. On a standard academic scale where 100% equals a perfect score, no film distributor earned a final inclusion grade above 25% across all tests.
The Inclusion Index for television and digital content revealed places for improvement and a few bright spots. Of the 50 tests conducted, seven Fully Inclusive and nine Largely Inclusive scores were awarded across the 10 companies evaluated on TV/digital content. The Walt Disney Company and The CW Network were the strongest performers in television, while for streaming content, Hulu and Amazon tied.
The report also assessed the executive ranks of the 10 companies. Roughly one-fifth of all chief executives, corporate boards, and executive management teams were comprised of women. Near gender parity was reached in television at the Executive Vice President level. Across film, television, and digital divisions, women were 46.7% of all Senior Vice President-level positions.
“A finding from our other studies regarding women in film is true of executive ranks as well. When power or influence increases, the percentage of females decreases,” said Katherine Pieper, USC Annenberg research scientist and one of the study’s authors.
The authors provide concrete solutions for the big challenges of increasing diversity on screen and behind the camera. “Organizations can take steps to solve inequality,” Marc Choueiti, one of the study authors, stated. “Our hope is that companies begin to implement these solutions and that the numbers will improve.”
The Inclusion Index rates organizations on five indicators regarding their media content and behind-the-scenes hiring practices. Those metrics are the percentage of females and underrepresented racial/ethnic groups on screen and the percentage of women working as directors and writers. Film companies were also scored on their representation of LGBT characters, while television and digital companies were graded on the percentage of female series creators working behind the camera.
On Feb. 22, USC Annenberg will host an event to examine the results of CARD. Industry thought leaders will gather to discuss solutions to Hollywood’s diversity problem. Read more about “Inclusion or Invisibility?” here.
USC Annenberg’s commitment to diversity
The report is the latest from the Media, Diversity, & Social Change Initiative. Located at the USC Annenberg School for Communication and Journalism, this is the first signature study of its Institute for Diversity and Empowerment, a research center examining inclusivity across media industries. IDEA’s goal is to make positive, long-lasting change and facilitate civic engagement.
“This important work is possible because USC Annenberg fosters great diversity and empowerment of women and people of color – in everything we do, from hiring to programming to curriculum,” said Dean Ernest J. Wilson III. “Lifting up the voices of the underrepresented is central to the mission of our school.”
The school has a broad and lasting commitment to diversity. USC Annenberg is the recipient of the Association for Education in Journalism and Mass Communication (AEJMC)’s Equity and Diversity Award in 2012. The same year, the school won a Federal Communications Commission competition to examine media ownership rules and their effect on localism and diversity, organizing a national consortium of 30 social scientists, legal scholars, journalists and communication experts. And last year, the Women’s Leadership Society at Annenberg M{2e} (Media, Economics and Entrepreneurship) formed with the aim of disrupting the male-dominated media and entertainment industries and building new opportunities for a future generation of thought leaders.
For the past two years, USC Annenberg has hosted a Summer Institute on Diversity in Media and Culture, which brings together students and faculty members from across the disciplines of Communication and Media Studies, around the United States, to focus workshops and seminars on issues of race, gender and media.
Just last month, the school announced a $5 million gift from the Annenberg Foundation to boost diversity in newsrooms by offering scholarships to students and fellowships to early-career journalists from diverse backgrounds. More information on The Annenberg Leadership Initiative is available here.
Key Findings
Females are Underrepresented On Screen Across the Entertainment Ecosystem
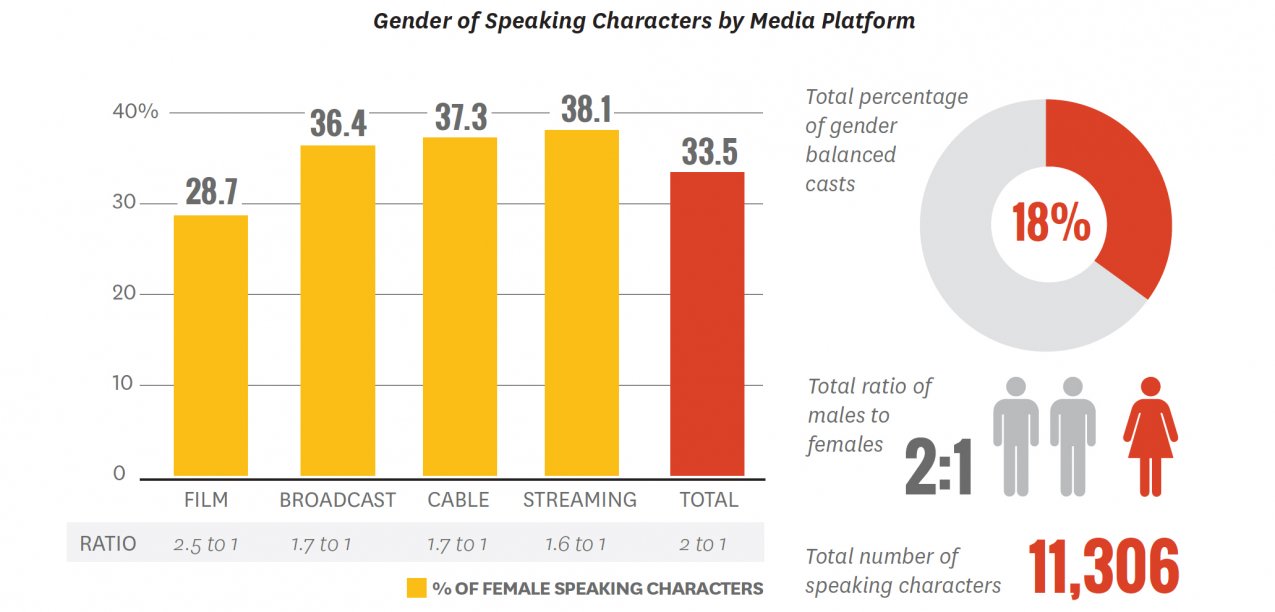
- Female characters fill only 28.7% of all speaking roles in film.
- For scripted series, less than 40% of all speaking characters were girls and women (broadcast=36.4%, cable=37.3%, streaming=38.1%).
- Only 18% of stories evaluated were gender balanced, with film (8%) the least likely to depict balance and cable the most likely (23%).
- A full 42% of series regulars were girls/women. Streaming featured the most females in the principal cast (44.2%), followed by broadcast (41.6%) and cable (41%).
- 35% of all characters were 40 years of age or older. Men fill 74.3% of these roles and women 25.7%. Film (21.4%) was less likely than broadcast (26.9%) or cable (29.4%) to show women 40 years of age or older. Streaming was the most likely, with females filling 33.1% of roles for middle age and elderly characters.
- Females were more likely than males to be shown in sexy attire (Females=34.3% vs. Males=7.6%), with some nudity (Females=33.4% vs. Males=10.8%) and physically attractive (Females=11.6% vs. Males=3.5%).
Females Face Erasure Behind the Camera, Particularly in Film
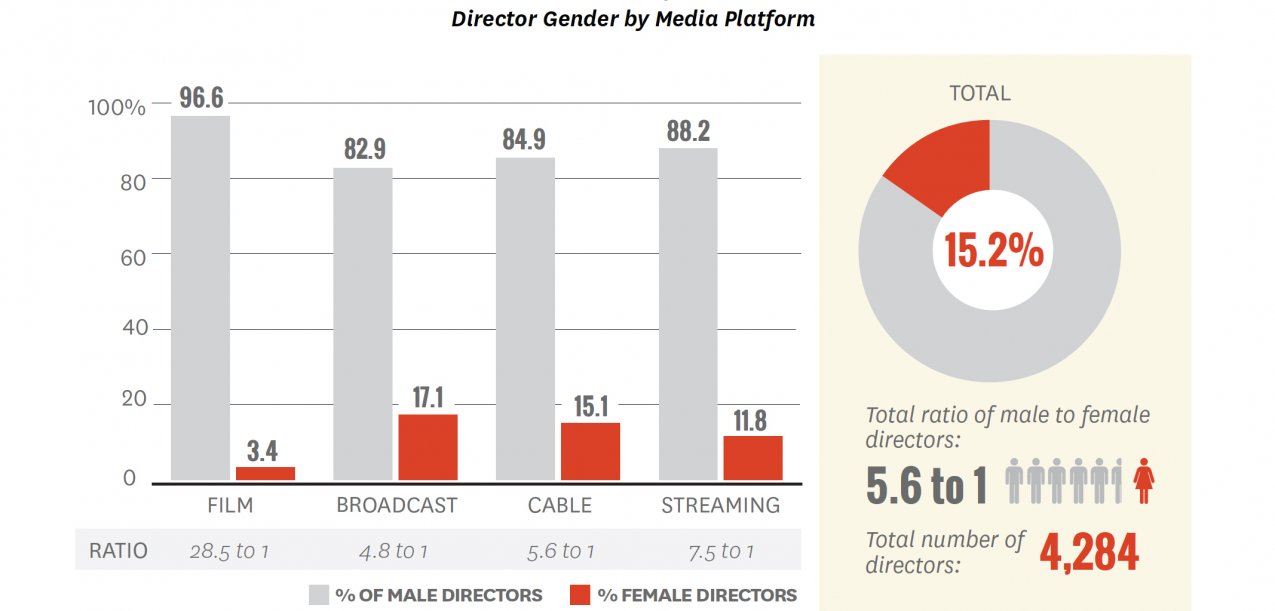
- A total of 4,284 directors were assessed for gender across all episodes of 305 scripted series and 109 motion pictures. A full 84.8% of directors were male (n=3,632) and 15.2% were female (n=652). This translates into a gender ratio of 5.6 males to every one female behind the camera in popular media.
- Only 3.4% of all film directors were female (n=4). Among TV and digital series, broadcast had the highest percentage of directors (17.1%) and streaming the lowest (11.8%). 15.1% of directors were female across cable shows.
- Across 6,421 writers, a full 71.1% were male and 28.9% were female. This means that for every one female screenwriter there were 2.5 male screenwriters.
- When compared to streaming (25.2%), females were the least likely to have screenwriting credits in film (10.8%) and the most likely in broadcast (31.6%). Females comprised 28.5% of writers on cable shows.
- A total of 487 creators were credited across the sample of TV/digital offerings. Almost a quarter of these creators were women (22.6%) and 77.4% were men. Of these show creators, 22% were female on the broadcast networks, 22.3% on cable channels, and 25% on streaming series.
- Stories with a female director attached had 5.4% more girls/women on screen than those stories without female direction (38.5% vs. 33.1%). For writers and creators, the relationship was more pronounced (10.7% and 12.6% increase, respectively).
- Across the 10 companies evaluated, women represent roughly 20% of corporate boards, chief executives, and executive management teams.
- As power increases, female presence decreases. In film, television, and streaming executive ranks, 46.7% of Senior Vice President-level executives are female. In television, near gender parity has been reached at the Executive Vice President tier.
Racial/Ethnic Groups Still Face Invisibility in the Entertainment Ecology
- 28.3% of all speaking characters were from underrepresented racial/ethnic groups, which is below (-9.6%) the proportion in the U.S. population (37.9%).
- Only 22 stories depicted proportional representation with U.S. population on the broadcast networks (19%), 18 on cable (13%), 1 on streaming (2%), and 8 in film (7%).
- At least half or more (52%) of all cinematic, television, or streaming stories fail to portray one speaking or named Asian or Asian American on screen. And, 22% of shows and movies evaluated fail to depict on screen one Black or African American speaking character.
- Out of the 407 directors evaluated, 87% were White and 13% were from underrepresented racial/ethnic groups. Only two of the 53 underrepresented directors in film and television/digital series were Black women.
- Cable shows (16.8% of directors) tended to attach an underrepresented director to their season premiere episodes more than broadcast (9.6% of directors) or streaming (11.4% of directors) shows. Film held an intermediate position across media, with 12.7% of all directors across 109 motion pictures from underrepresented groups.
- The percentage of on screen underrepresented characters increases 17.5% when an underrepresented director is at the helm of a scripted episode or film. Only 26.2% of characters were underrepresented when directors were White whereas 43.7% were underrepresented when directors were from racial/ethnic minority groups.
Equity in Portrayals is Not Existent for the LGBT Community
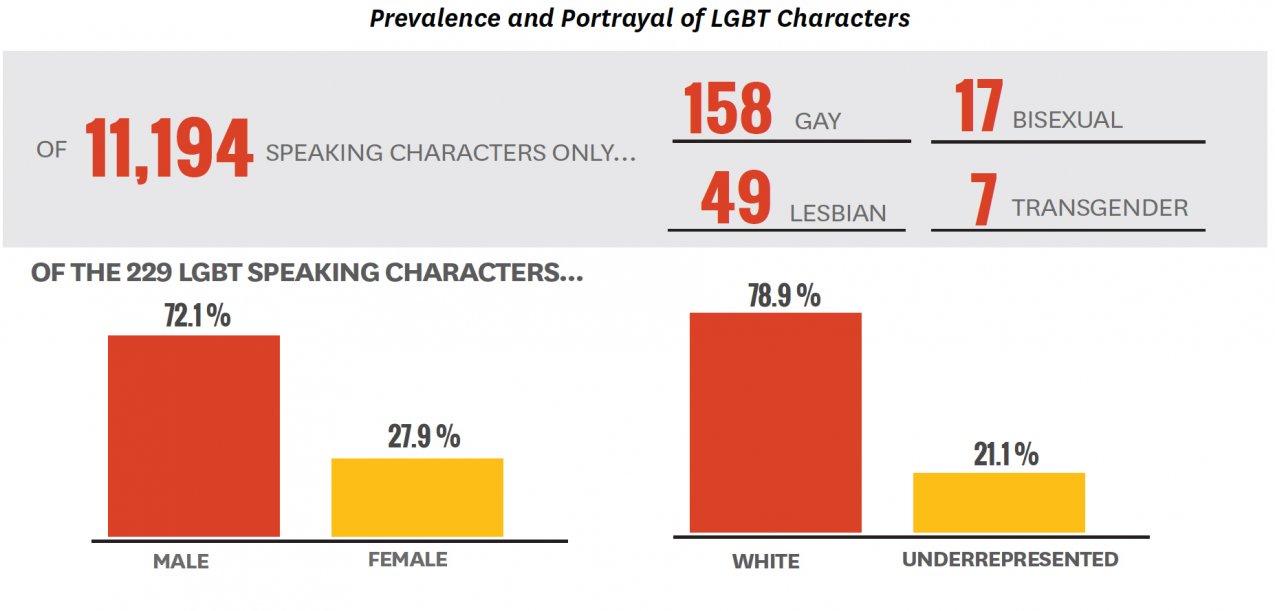
- 2% of all speaking characters across the 414 movies, television shows, and digital series evaluated were coded LGB.
- Only seven transgender characters appeared across 414 stories evaluated.
- Almost a third of the 229 LGBT characters appeared in cable shows (31.4%, n=72), 28.8% (n=66) in film, 24% (n=55) in broadcast, and 15.7% (n=36) in streaming. Over half of the portrayals (58%) in movies were accounted for by two films.
- Of all LGBT characters, nearly three quarters (72.1%) were male and 27.9% were female. The vast majority of LGBT characters were White (78.9%) and only 21.1% were from underrepresented racial/ethnic groups.
- Few LGBT characters were shown as parents or caregivers, with females (24%) slightly more likely to be shown in this light than males (16.4%).
Key Differences Exist between Film and Television/Digital Inclusion Profiles
- Of the 30 tests conducted for film companies, 24 or 80% yielded a Not Inclusive ranking. On a standard academic scale with 100% a perfect score, no film distributor earned a final inclusion grade above 25% across all tests. As such, every film company evaluated earned a Failing score on inclusivity.
- Of the 50 tests conducted, seven Fully Inclusive and nine Largely Inclusive scores were awarded across the 10 companies evaluated on their TV/digital content.
- The Walt Disney Company and The CW Network are the top performers when it comes to inclusion in television/digital series. Disney succeeds in representing women and underrepresented characters on screen. Both companies evidence hiring practices behind the camera for writers and show creators that approach balance.
- Hulu and Amazon performed strongly due to their inclusivity of women. Amazon was the only company rated Fully Inclusive for hiring female directors.
